EADU 8320E NASA Survival Activity
Karen Watkins, a professor at the University of Georgia, wanted to create a learning experience for her graduate students enrolled in the online HROD (Human Resources and Organizational Development) program. This activity required the students to individually rank a series of items in order of importance that they believed would ensure their survival on the surface of the moon. They would then compare their rankings to those of the other members of their group, discuss why any disparities may exist, and then come to a final consensus as to what to bring with them, with the final step of comparing their group rankings to those of experts from NASA.
For this project, I created a Google Site to host the learning activity. I produced a short, engaging video to capture the attention of my audience, along with clear instructions on how to begin, finish, and analyze the survey activity. Displaying the survey results in interactive charts required me to create a Google Apps script that identified each individual variable and graph it in comparison to the other members of that individual’s group. Bringing all of these materials together and implementing them effectively on the activity site was quite the challenge- if I were to do this project again I would have requested additional support in testing out all the variables in the survey together. I was unable to account for every eventuality and, as a result, some individuals encountered difficulty with the activity when it came time for them to complete the coursework.
For this project, I created a Google Site to host the learning activity. I produced a short, engaging video to capture the attention of my audience, along with clear instructions on how to begin, finish, and analyze the survey activity. Displaying the survey results in interactive charts required me to create a Google Apps script that identified each individual variable and graph it in comparison to the other members of that individual’s group. Bringing all of these materials together and implementing them effectively on the activity site was quite the challenge- if I were to do this project again I would have requested additional support in testing out all the variables in the survey together. I was unable to account for every eventuality and, as a result, some individuals encountered difficulty with the activity when it came time for them to complete the coursework.
EADU 8320E Team Learning Survey Activity
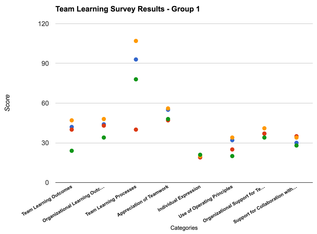
Another project I completed for Karen Watkins, the purpose of the Team Learning Survey Activity was to determine how well the students’ eLC groups were operating as a learning group. It was designed in conjunction with Dr. Victoria Marsick at Columbia University to help groups and organizations determine the extent to which their teams are engaged in learning and assist in analyzing the conditions that foster or impede learning.
My role in this project was similar to the NASA project above: create a Google Site to house the content, set up a Google form for students to input data, and code a Google Apps script that would then automatically graph that data for comparison amongst group members. One difference with this project was my developing an Articulate Storyline survey module for the students to interact with. This 60-question Likert style survey automatically sorted the students’ answers into various categories and tabulated scores based on the categories’ values. If I were to tackle this project again, I would not host the Storyline file on Google Drive - some students encountered issues with the module freezing up when it was hosted there. Once I moved the files to a private server, everything worked fine.
My role in this project was similar to the NASA project above: create a Google Site to house the content, set up a Google form for students to input data, and code a Google Apps script that would then automatically graph that data for comparison amongst group members. One difference with this project was my developing an Articulate Storyline survey module for the students to interact with. This 60-question Likert style survey automatically sorted the students’ answers into various categories and tabulated scores based on the categories’ values. If I were to tackle this project again, I would not host the Storyline file on Google Drive - some students encountered issues with the module freezing up when it was hosted there. Once I moved the files to a private server, everything worked fine.
